• Skip to primary navigation
  • Skip to main content
  • Skip to primary sidebar

5 Circles Research

  • Overview
  • SurveysAlaCarte
  • Full Service
  • About
  • Pricing Gurus
  • Events
  • Blog
  • Contact

Pricing Gurus and 5 Circles Research Blog Posts

When More is More: taking advantage of purchaser (mis)understanding of discounts.


Should you offer a discount to kick start sales of a new product? Or to revive sales of a forgotten product or service? Pricing Gurus recommends you hold the line and treat discounts as temporary, lest you simply lower the prices. But that’s the subject of a different blog post.

For today, let’s explore a price discount versus offering more for the same price – a bonus. You can create the same net effect either way in terms of the price for each item purchased, so why is this of interest?
It turns out that it makes a difference which way the offer is created. Ashkay Rao, the General Mills Chair in Marketing, Carlson School of Management, University of Minnesota, headed a team of researchers investigating the topic. They concluded that offering more for the same price (a bonus) was more effective than the equivalent deal offered as a discount. One example, in a series of well-constructed field experiments, was a bottle of hand lotion regularly priced at $13.50. Consumers significantly preferred a bonus offer of 50% more lotion in a larger bottle for the same price over a discount of 35% (the same size bottle for $8.75). The bonus of 50% is the equivalent as a discount of 33%, so the actual discount offer was even better. Yet the research showed that purchasers are more impressed by the idea of more stuff than spending less money.

The paper, published in the Journal of Marketing, uses the term “Base Value Neglect” for the phenomenon. I prefer the Economist’s description – “most people are useless at fractions”.

How can your business take advantage of purchasers’ perceptions? Are you fooling people? Does it work for services? My thoughts:

  • When you offer more for the same price, your revenue per sale is higher. Your costs are probably not linear – think of packaging, distribution, etc. – that’s why the Econo size costs less per ounce. Whereas discounting the same package isn’t as good for the vendor.
  • You certainly aren’t cheating or fooling people. You are offering a deal either way (and remember, it’s a limited time offer), but you are just choosing to make the offer that more people will take up.
  • Services have some of the same non-linear characteristics as products. A SaaS service incurs setup costs. Does adding a few months (the bonus) cost relatively little? I hope so. You’ll be more likely to keep the customer after the bonus period – at the same renewal price. Compare that with convincing the customer to renew at the full price – not impossible, but more difficult.
  • What about professional services and other intensely people-based services? It’s still non-linear. The overhead of setting up and managing a project should be a smaller percentage as project size increases. When you offer a bonus this is still true. And again, you’ll stand a better chance of a repeat project at full-price (without the extra service you provided as a bonus), than increasing the price for the same services.

So, when you are next thinking of an offer to increase sales and expand your customer base, perhaps to respond to a price cut by a competitor, consider offering a bonus rather than discounting.

GuruMike (Mike Pritchard)

Filed Under: Pricing

Pricing Innovations – A Tale of Two Companies


Being innovative in pricing takes some good old-fashioned marketing work. You not only have to understand the value that you are delivering, but you also have to understand the personas that make up your customer base. Pricing Gurus has been tracking two companies that made significant innovative changes in their pricing structure: J.C. Penney and LinkedIn. Let’s take a look at how one company has done very well with their new pricing, and how one may be teetering on the edge of extinction because of it.

JC Penney

In November of 2011, JC Penney hired Ron Johnson to take on the CEO role at JC Penney. Johnson had previously worked as head of Apple’s retail strategy and had successfully opened over 200 Apple stores. (Upon leaving Apple for JC Penney, Steve Jobs asked Johnson “are you serious?”) Before working at Apple, Johnson had served as VP of Merchandising for Target stores.

Johnson was quoted in an AP interview (January 30th, 2012) saying that “Pricing is actually a pretty simple and straightforward thing. Customers will not pay literally a penny more than the true value of the product.” At Pricing Gurus, we find humor in this quote because while “not paying more than true value” is simple in concept, determining the true value and what value customers want is hard.

On February 1st, 2012, Ron Johnson announced his plans to eliminate many of the promotions that JC Penney was known for, and move towards a philosophy of everyday low pricing. Johnson’s plan was to tell customers that they didn’t have to spend time anymore clipping coupons or waiting for sales to happen. Instead the store would offer fair prices on its merchandise every day.

It turns out the JC Penney customers liked clipping coupons and crowding in for sales. They valued the experience. They didn’t like the new pricing or the new store layouts. In an NPR interview on March 1st, Carol Vickery who shopped at the JC Penney in Tallahassee, Fla. said: “I come home and I cry over it, and my husband’s looking at me, like, ‘What’s wrong?’ I said, ‘Penney’s doesn’t have sales anymore. I need my store back!’ ”

The result of this has been a financial disaster for JCPenney. In Q4 of 2012, they announced a same store sales drop of 31.7% and in Q1 of 2013 sales continue to fall. Their stock price has slid from $40 in March of 2012 to $15 on March 6th 2103. As a comparison, Macy’s stock price is slightly higher than it was a year ago and same store sales were up 3.7% for the year.JC Penney

In November of 2011, JC Penney hired Ron Johnson to take on the CEO role at JC Penney. Johnson had previously worked as head of Apple’s retail strategy and had successfully opened over 200 Apple stores. (Upon leaving Apple for JC Penney, Steve Jobs asked Johnson “are you serious?”) Before working at Apple, Johnson had served as VP of Merchandising for Target stores.

Johnson was quoted in an AP interview (January 30th, 2012) saying that “Pricing is actually a pretty simple and straightforward thing. Customers will not pay literally a penny more than the true value of the product.” At Pricing Gurus, we find humor in this quote because while “not paying more than true value” is simple in concept, determining the true value and what value customers want is hard.

On February 1st, 2012, Ron Johnson announced his plans to eliminate many of the promotions that JC Penney was known for, and go towards a philosophy of everyday low pricing. Johnson’s plan was to tell customers that they didn’t have to spend time anymore clipping coupons or waiting for sales to happen. Instead the store would offer fair prices on its merchandise every day.

It turns out the JCPenney customers liked clipping coupons and crowding in for sales. They valued the experience. They didn’t like the new pricing or the new store layouts. In an NPR interview on March 1st, Carol Vickery who shopped at the JC Penney in Tallahassee, Fla. said: “I come home and I cry over it, and my husband’s looking at me, like, ‘What’s wrong?’ I said, ‘Penney’s doesn’t have sales anymore. I need my store back!’ ”

The result of this has been a financial disaster for JCPenney. In Q4 of 2012, they announced a same store sales drop of 31.7% and in Q1 of 2013 sales continue to fall. Their stock price has slid from $40 in March of 2012 to $15 on March 6th 2103. As a comparison, Macy’s stock price is slightly higher than it was a year ago and same store sales were up 3.7% for the year.

LinkedIn

On a positive note, let’s look at the new pricing structure from LinkedIn. If you have a LinkedIn account, you’ve undoubtedly seen many of the changes to the site – even if you are a free subscriber. Some of the changes have been beneficial to all, while many changes have made features accessible only to those that invest in a paid subscription. LinkedIn now offers twelve different paid account types distributed among four market segments: Business, Talent, Job Seeker and Sales.

As a long time user of LinkedIn, I appreciate the value that it delivers to me. It has not only become my extended list of “contacts,” but I have also have gotten business opportunities through my free LinkedIn subscription. As professionals see the value in these extended offerings, paid subscriptions will continue to grow.

In an interesting twist, LinkedIn has gained value by taking away from one of its core set of users – recruiters. According to Michael Overall of RecruitLoop, “In the good old days, the biggest perceived asset of recruiters was their “little black books” or proprietary databases. Now everyone has access to the LinkedIn database and companies are learning that they can bypass recruiting “agencies” by directly accessing LinkedIn products themselves.

As a result of this offered value, as of March 4th 2013, LinkedIn share traded at $178 which is significantly up from its May 2011 IPO price of $45 per share. Revenues in 2012 were 86% higher than in 2011. By comparison Monster Worldwide (Monster.com) share price has dropped over 37% in the past year.

LinkedIn has certainly shown that it is possible to be successful with a Freemium model. Pricing Gurus feels that LinkedIn has been successful in delivering the value to customers who want paid subscriptions. This tends to quiet the grumblings of those who “used to get it for free.” Customers want LinkedIn to stay in business and provide the services they are currently getting.

Observations

Unlike Ron Johnson, Pricing Gurus feels that getting pricing right can be complex – and must be delivered in a way that customers want. JCPenney made sweeping changes to the whole organization where LinkedIn was very strategic in offering specific value to its four distinct target markets.

[Post contributed by Dan DeVries, Wild Horse Strategies]


Filed Under: Pricing

Predicting Olympic Records

An article in the New York Times, “Which Records Get Shattered?“, analyzes the prospects for record-breaking at the 2012 Summer Olympics in London. Nate Silver returns to sports analysis – his old stomping ground before he started the FiveThirtyEight blog which covers election polling.

Phelps4x100 John Nunn wins 50K
Michael Phelps, 4x100m relay, Beijing 2008 Olympics John Nunn winning his place on the US 2012 Olympic team in the 50K racewalk

The last time I commented on a Nate Silver article, he was predicting winners at the Academy Awards. Nate’s performance that time wasn’t good. He was out of his element in an event that often has upsets.

Besides returning to his roots, Nate is playing it safe by not predicting the outcome of specific events. He took the same tack in an article a couple of weeks ago, “Let’s Play MedalBall!” which gave advice to nations aspiring to achieve Olympic medals.

But let’s return to the topic of Olympic records. I liked the analysis in the article, as well as some aspects of the presentation of the results. Silver calculated percentage improvements in performances between the 1968 Olympics (Mexico City) and 2012 (London). To avoid effects of outliers, the statistical approach incorporated all Olympic performances, not just records. I don’t know if there was any correction made for the 7,300 feet altitude in Mexico City, but any effect would have been eliminated over the 40 years of the data. The calculations were based on time for the most part, but distance was used for field events like javelin, discus, and long jump.

The main conclusion of the analysis is that some types of events have exhibited overall greater performance improvements than others; these are the events where records are more likely be broken. In particular, swimming events improved by an average of 10.3% from 1968 to 2008, while track and field events improved by an average of 4.1%. In fact, in track and field performance has actually declined in a couple of events (javelin and shot-put), but as can be seen easily from the chart these are anomalies. Also notable is that the greatest improvements in track and field are for the longer events including racewalking (who knew?)

Silver offers some reasons for the differences, but I don’t know if any formal correlation analyses were done for his independent variables. He suggests that technology has benefited swimming in particular through better costumes and better pools, whereas runners haven’t had any significant tools to help them over the same period. Also, Nate writes, those from poorer nations have less access to swimming pools which means that the group of potential stars was limited as compared to athletics where little equipment is needed. It seems possible to me that these new stars are added to the pool (pun intended) through economic improvements in their own countries as well as some migration; I haven’t analyzed this – it’s just a theory.

Reporting

The article uses a long horizontal bar chart that works well in the broadsheet format of the New York Times. Silver combines male and female (distinguished by bold), and uses color to identify different types of events, arrayed in order of performance improvements.  Nice job!

But how could you convey something similar in a normal style of research report – landscape format PowerPoint, with limited room on the vertical axis?

  • Turning the whole thing on its side isn’t going to work well. The length of the text for the events wouldn’t look good along the X axis, even when the text is angled. And using vertical bars might not convey the differences as well, but in any case there are still too many events for the effects to be properly communicated.
  • I’d use a version of the chart as an inset, as large as possible, and then pull out subsets to show specific points. This would perhaps work even better. Events could be grouped by type and gender, perhaps separating gender within sports. The current chart makes it fairly clear that female swimming has improved more than male, but with the inclusion of some field events in the mix the point is less clear.  Three or four additional smaller charts supporting the main chart should do the trick. And you could hover over the PowerPoint to confirm anything that’s unclear to the people in the back of the room.

Actually the online version of the article uses only a clipped version of the chart as a teaser. The full chart is accessible in a separate browser window.

I hope this post has given you a few ideas about reporting a complex topic.  As for records at the 2012 Olympics, it’s too soon to know if the trends seen in the article will continue, as many of the events with the most improvement haven’t yet been held. There have already been some new records in swimming. Other records include weightlifting and archery, which weren’t covered in the article. Personally, I’d like to see a gold medal or two for my homeland, never mind a record. After the disappointment with synchronized diving, even a win in a lower profile sport might boost Britons’ morale. No predictions from me, but I’ll be keeping an eye out for trampoline and rowing (where Katherine Grainger and Anna Watkins have already broken the Olympic record).

Update August 3rd: Grainger and Watkins succeeded, and Britain is now in 3rd place for medals, behind China and the U.S. (showing the home country boost). There have been quite a few Olympic records broken in swimming, consistent with Nate Silver’s analysis. Most of the other events he analyzed are still under way.

Idiosyncratically,

Mike Pritchard


Image sources:

John Nunn Racewalking: By U.S. Army (Flickr: John Nunn wins 50K) [CC-BY-2.0], via Wikimedia Commons
Michael Phelps: By Jmex60 (Own work) [GFDL or CC-BY-SA-3.0-2.5-2.0-1.0], via Wikimedia Commons

Filed Under: Fun, Published Studies, Reporting, Statistics

QR codes not hitting the spot

QR code with question mark

Many marketing people have been promoting the value of QR codes for quite a while. After all, the promise seems obvious – post a targeted code somewhere, make it easy for someone to reach the website, and track the results of different campaigns.

Studies such as this February 2011 survey from Baltimore based agency MGH seem to confirm the positives. 415 smartphone users from a panel were surveyed. 65% had seen a QR code, with a fairly even split between male and female. Of those who’d seen a code, 49% had used one, and 70% say they would be interested in using a QR code (including for the first time). Reasons for the interest include:

  • 87% to get a coupon, discount, or a deal
  • 64% to enter a sweepstake
  • 63% to get additional information
  • 60% to make a purchase

31% say they’d be “Very Likely” to remember an ad with a QR code, and a further 41% say they’d be “Somewhat Likely” to remember.

The published survey results don’t cover whether people actually made purchases, or did anything else once they’d visited the site (32%). But let’s look at what gets in the way of using the QR code in the first place.

The February 2012 of Quirk’s Magazine has a brief article, titled “QR Codes lost on even the savviest“, referencing work done by Archival (a youth marketing agency). The thrust is that if QR codes are to succeed, they should be adopted by college students who are smartphone users. However, although 80% had seen a QR code, and 81% owned a smartphone, only 21% successfully scanned the QR code used as part of the survey, and 75% say they are “Not Likely” to scan a QR code in future. A few more details from the study and a discussion are at http://www.archrival.com/ideas/13/qr-codes-go-to-college. I suspect the Archrival results reflect market reality more than MGH, but in any case QR codes are not living up to expectations. When was the last time you saw someone use a QR code?

Some may place the blame with marketers who don’t do as good as job as they should of communicating the benefits, and indeed having something worthwhile in the landing page. But technology is probably the most important factor. Reasons noted by the students include:

  • Needing to install an app. Why isn’t something pre-installed with more phones?
  • Expecting just to be able to take a picture to activate the QR code. Why shouldn’t this work?
  • Takes too long. Of course, they are right.

To these reasons, I’d add that there is currently some additional confusion caused by the introduction of new types of codes. Does the world need Microsoft Tag and yet another app?

Maybe QR codes will suffer the same fate as some previous technology driven attempts to do something similar. Does anyone remember Digimarc’s MediaBridge from 2000? Did it ever seem like a good idea to scan or photograph an advertisement in a printed page to access a website? What about the RadioShack CueCat? Perhaps Digimarc has a better shot with their new Discover™ service that includes a smartphone app as well as embedded links in content. If you are already a Digimarc customer, or don’t want to sully the beauty of your images with codes – maybe it’s the answer. But that seems like a limited market compared with the potential that’s available for QR codes done right.

Come on technologists and marketers – reduce the friction in the system!

Idiosyncratically,

Mike Pritchard

Filed Under: Methodology, News, Published Studies

IT terminology applied to surveys

James Murray is principal of Seattle IT Edge, a strategic consultancy that melds the technology of IT with the business issues that drive IT solutions. When James gave me a list of things that are central for IT professionals, I thought it might be fun (and hopefully useful) to connect these terms with online surveys for market research.

[Warning: if you are a technical type interested in surveys, you might find this interesting. But if you aren’t in that category, I won’t be offended if you stop reading.]

Scalability

The obvious interpretation of scalability for IT applies to online surveys too. Make sure the survey tool you use is capable of handling the current and predicted usage for your online surveys.

  • If you use an SaaS service, such as SurveyGizmo or QuestionPro, does your subscription level allow you to collect enough completed surveys? This isn’t likely to be an issue if you host your own surveys (perhaps with an open-source tool like Lime Survey) as you’ll have your own database.
  • Do you have enough bandwidth to deliver the survey pages, including any images, audio or video that you need? Bandwidth may be more of an issue with self-hosted surveys. Bandwidth might fit more into availability, but in any case think about how your needs may change and whether that would impact your choice of tools.
  • How many invitations can you send out? This applies when you use a list (perhaps a customer list or CRM database), but isn’t going to matter when you use an online panel or other invitation method. There are benefits to sending invitations through a survey service (including easy tracking for reminders), but there may be a limit on the number of invitations you can send out per month, depending on your subscription level. You can use a separate mailing service (iContact for example), and some are closely integrated with the survey tool. Perhaps the owner of the customer list wants to send out the invitations, in which case the volume is their concern but you’ll have to worry about integration. Most market researchers should be concentrating on the survey, so setting up their own mail server isn’t the right approach; leave it to the specialists to worry about blacklisting and SPF records.
  • Do you have enough staff (in your company or your vendors) to build and support your surveys? That’s one reason why 5 Circles Research uses survey services for most of our work. Dedicated (in both senses) support teams make sure we can deliver on time, and we know that they’ll increase staff as needed.

Perhaps it’s a stretch, but I’d also like to mention scales for research. Should you use a 5-point, 7-point, 10-point or 11-point scale? Are the scales fully anchored (definitely disagree, somewhat disagree, neutral, somewhat agree, definitely agree)? Or do you just anchor the end points? IT professionals are numbers oriented, so this is just a reminder to consider your scales. There is plenty of literature on the topic, but few definitive answers.

Usability

Usability is a hot topic for online surveys right now. Researchers agree that making surveys clear and engaging is beneficial to gathering good data that supports high quality insights. However, there isn’t all that much agreement on some of the newer approaches. This is a huge area, so here are just a few points for consideration:

  • Shorter surveys are (almost) always better. The longer a survey takes, the less likely it is to yield good results. People drop out before the end or give less thoughtful responses (lie?) just to get through the survey. The only reason for the “almost” qualifier is that sometimes survey administrators send out multiple surveys because they didn’t include some key questions originally. But the reverse is the problem in most cases. Often the survey is overloaded with extra questions that aren’t relevant to the study.
  • Be respectful of the survey taker. Explain what the survey is all about, and why they are helping you. Tell them how long it will take – really! Give them context for where they are, both in the form of textual cues, and also if possible with progress bars (but watch out for confusing progress bars that don’t really reflect reality). Use survey logic and piping to simplify and shorten the survey; if someone says they aren’t using Windows, they probably shouldn’t see questions about System Restore.
  • Take enough time to develop and test questions that are appropriate for the audience and the topic. This isn’t just a matter of using survey logic, but writing the questionnaire correctly in the first place. Although online survey data collection is faster than telephone, it takes longer to develop the questionnaire and test.
  • Gamification of surveys is much talked about, but not usually done well. For a practical, business-oriented survey taker, questions that aren’t as straightforward may be a deterrent. On the other hand, a gaming audience may greatly appreciate a survey that appears more attuned to them. Beyond the scope of this article, some research is being conducted within games themselves.

Reliability

One aspect of reliability is uptime of the server hosting the survey tool. Perhaps more relevant to survey research are matters related to survey and questionnaire design:

  • Representativeness of the sample within the target population is important for quality results, but the target depends on the purpose of the research. If you want to find out if a new version of your product will appeal to a new set of prospects, you can’t just survey customers. An online panel sample is generally regarded as representative of the market.
  • How you invite people to take the survey also affects how representative the sample is. Self selection bias is a common issue; an invitation posted on the website is unlikely to work well for a general survey, but may have some value if you just need to hear from those with problems. Survey invitations via email are generally more representative, but poor writing can destroy the benefit.
  • As well as who you include and how you invite them, the number of participants is important. Assuming other requirements are met, a sample of 400 yields results that are within ±5% at 95% reliability. The confidence interval (±5%) means that the results from the sample will be within that range of the true population’s results. For the numerically oriented, that’s a worst case number, true for a midpoint response; statistical testing takes this into account. The reliability number (95%) means that the results will conform 19 out of 20 times. You can play with the sample size, or accept different levels of confidence and reliability. For example, a business survey may use a sample of 200 (for cost reasons) that yields results that are within ±7% at 95% reliability.
  • Another aspect of reliability comes from the questionnaire design. This is a deep and complex subject, but for now let’s just keep it high-level. Make sure that the question text reflects the object of the question, that the options are exclusive, single thoughts, exhaustive (with don’t know, none of the above, or other/specify as appropriate).

Security

Considerations for survey security are similar to those for general IT security, with a couple of extra twists.

  • Is your data secure on the server? Does your provider (or do you if you are hosting your own surveys) take appropriate precautions to make sure that the data is backed up properly and is guarded against being hacked into?
  • Does the connection between the survey taker and the survey tool need to be protected? Most surveys use HTTP, but SSL capabilities are available for most survey tools.
  • Are you taking the appropriate measures to minimize survey fraud (ballot stuffing?) What’s needed varies with the type of survey and invitation process, but can include cookies, personalized invitations, and password protection.
  • Are you handling the data properly once exported from the survey tool? You need to be concerned with overall data in the same way that the survey tool vendor does. But you also need to look after personally identifiable information (PII) if you are capturing any. You may have PII from the customer list you used for invitations, or you may be asking for this information for a sweepstake. If the survey is for research purposes, ethical standards require that this private information is not misused. ESOMAR’s policy is simple – Market researchers shall never allow personal data they collect in a market research project to be used for any purpose other than market research. This typically means eliminating these fields from the file supplied to the client. If the project has a dual purpose, and the survey taker is offered the opportunity for follow up, this fact must be made clear.

Availability

No longer being involved in engineering, I’d have to scratch my head for the distinction between availability and reliability. But as this is about IT terms as they apply to surveys, let’s just consider making surveys available to the people you want to survey.

  • Be careful about question types that may work well on one platform and not another, or may not be consistently understood by the audience. For example, drag and drop ranking questions look good and have a little extra zing, but are problematic on smart phones. Do you tell the survey taker to try again from a different platform (assuming your tool detects properly), or use a simpler question type? This issue also relates to accessibility (section 508 of the Rehabilitation Act, or the British Disability Discrimination Act). Can a screen reader deal with the question types?
  • Regardless of question types, it is probably important to make sure that your survey is going to look reasonable on different devices and browsers. More and more surveys are being filled out on smartphones and iPads. Take care with fancier look and feel elements that aren’t interoperable across browsers. These days you probably don’t have to worry too much about people who don’t have JavaScript available or turned on, but Flash could still be an issue. For most of the surveys we run, Flash video isn’t needed, and in any case isn’t widely supported on mobile devices. HTML5 or other alternatives are becoming more commonly used.
  • Instead of accessing web surveys from any compatible mobile devices, consider other approaches to surveying. I’m not a proponent of SMS surveys; they are too limited, need multiple transactions, and may cost the survey taker money. But downloaded surveys on iPad or smartphone have their place for situations where the survey taker isn’t connected to the internet.

I hope that these pointers are meaningful for the IT professional, even with the liberties I’ve taken. There is plenty of information As you can tell, just like in the IT world there are reasons to get help from a research professional. Let me know what you think!

Idiosyncratically,

Mike Pritchard

Filed Under: Fun, Methodology, Surveys, SurveyTip

Survey Tip: Pay Attention to the Details

Why survey creators need to pay more attention to the details of wording, question types and other matters that not only affect results but also how customers view the company. A recent survey from Sage Software had quite a few issues, and gives me the opportunity to share some pointers.

The survey was for follow up satisfaction after some time with a new version of ACT! Call me a dinosaur, but after experiments with various online services, I still prefer a standalone CRM. Still, this post isn’t really about ACT! – I’m just giving a little background to set the stage.

  • The survey title is ACT! Pro 2012 Customer Satisfaction Survey. Yet one of the questions asks the survey taker to compare ACT 2011 with previous versions. How dumb does this look?
    Image:Survey title doesn't match question
  • This same question has a text box for additional comments. The box is too small to be of much use, but also the box can’t be filled with text. All the text boxes in the survey have the the same problem.
    Image: Comment boxes should be big enough
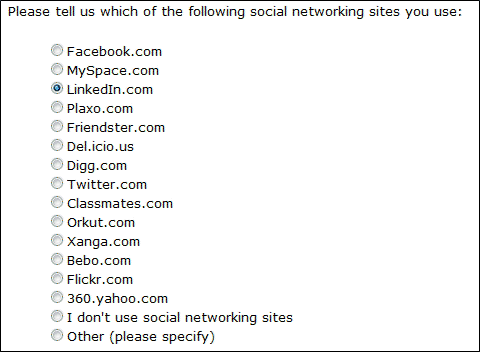
  • If you have a question that should be multiple choice, set it up correctly.
    Image: Use multiple choice properly
    Some survey tools may use radio buttons for multiple choice (not a good idea), but this isn’t one of them. This question should either be reworded along the lines of “Which of these is the most important social networking site you use“, or – probably better – use a multiple choice question type.
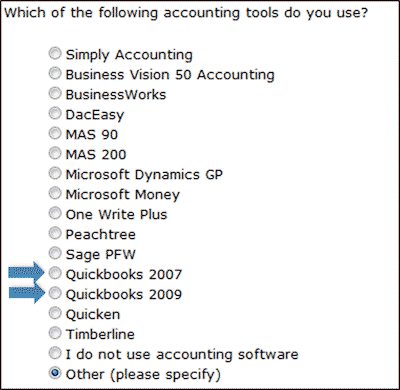
  • Keep up to date.
    Image: Keep up to date with versions
    What happened to Quickbooks 2008, or more recent versions? It would have been better to simply have Quickbooks as an option (none of the other products had versions). If the version of Quickbooks was important (I know that integration with Quickbooks is a focus for Sage) then a follow up with the date/version would work, and would make the main question shorter.
  • There were a couple of questions about importance and performance for various features. I could nitpick the importance question (more explanation about the features or an option something like “I don’t know what this is” would have been nice), but my real issue is with the performance question. 20 different features were included in both importance and performance. That’s a lot to keep in mind, so it’s good to try to make the survey taker’s life easier by keeping the order consistent between importance and performance. The problem was that the order of the performance list didn’t match the first. I thought at first that the lists were both randomized separately, instead of randomizing the first list and using the same order for the second. This is a common mistake, and sometimes the survey software doesn’t support doing it the right way. But after trying the survey again, I discovered the problem was that both lists were fixed orders, different between importance and performance. Be consistent. Note, if your scales are short enough, and if you don’t have a problem with the survey taker adjusting their responses as they think about performance and importance together (that’s a topic of debate among researchers) you might consider showing importance and performance together for each option.
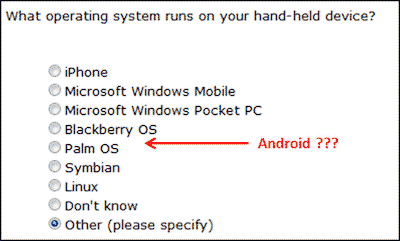
  • Keep up to date – really! The survey asked whether I used a mobile computing device such as a smartphone. But the next question asked about the operating system for the smartphone without including Android. Unbelievable!
    Image: Why not include Android in smart phone OS list?

There were a few other problems that I noted, but they are more related to my knowledge of the product and Sage’s stated directions. But similar issues to those above occur on a wide variety of surveys. Overall, I score this survey 5 out of 10.

These issues make me as a customer wonder about the competence of the people at Sage. A satisfaction survey is designed to learn about customers, but should also create the opportunity to make the customers feel better about the product and the company. However, if you don’t pay attention to the details you may do more harm than good.

Idiosyncratically,

Mike Pritchard

Filed Under: Methodology, Questionnaire, SurveyTip Tagged With: Survey Tips, Surveys

  • « Go to Previous Page
  • Go to page 1
  • Go to page 2
  • Go to page 3
  • Go to page 4
  • Interim pages omitted …
  • Go to page 6
  • Go to Next Page »

Primary Sidebar

Follow us on LinkedIn Subscribe to Blog via RSS Subscribe to Blog via Email
Every conversation with Mike gave me new insight and useful marketing ideas. 5 Circles’s report was invaluable in deciding on the viability of our new product idea.
Greg HowePresidentCD ROM Library, Inc.
You know how your mechanic knows what’s wrong with your car when you just tell them what it sounds like over the phone? Well, my first conversation with Mike was like that — in like 10 seconds, he gave me an insight into my market research that was something I’d been struggling trying to figure out. A class like this will help you learn what you can do on your own. And, you’ll have a better idea of what a research vendor can do for you.
Roy LebanFounder and CTOPuzzazz
Since becoming our contracted consultant for market research services in 2010, 5 Circles Research has revolutionized our annual survey of consumer opinion in Washington. Through the restructuring of survey methodology and the application of new analytical tools, they have provided insights that are both wider in their scope and deeper in their relevance for understanding consumer values and behavior. As a result, the survey has increased its significance as a planning and evaluation tool for our entire state agency. 5 Circles does great work!
Blair ThompsonDirector of Consumer CommunicationsWashington Dairy Products Commission
Many thanks to you for the very helpful presentation on pricing last night. I found it extremely useful and insightful. Well worth the drive down from Bellingham!
G.FarkasCEOTsuga Engineering
I have come to know both Mike and Stefan as creative, thoughtful, and very diligent research consultants. They were always willing to go further to make sure respondents remained engaged and any research results were applicable and of immediate use to us here at Bellevue CE. They were partners and thought leaders on the project. I am happy to recommend them to any public sector client.
Radhika Seshan, Ph.DRadhika Seshan, Ph.D, Executive Director of Programs Continuing Education Bellevue College
First, I thought it was near impossible to obtain good market information without a large scale, complex market study. Working with 5 Circle Research changed that. We were able to put together a comprehensive survey that provided essential information the company was looking for. It started with general questions gradually evolving to specifics in a fast pace, fun to take questionnaire. Introducing “a new way of doing things” like Revollex’ induction heating-susceptor technology can be challenging. The results provided critical data to help understand the market demand. High quality work, regard for schedule, thorough understanding of the issues are just a few aspects of an overall exceptional experience.
Robert PoltCEORevollex.com
I hired Mike to develop, execute and report on a market research project involving a potential business opportunity. I was impressed with his ability to learn the industry and subsequently develop a framework for the market research project. He was able to execute the research and collect data efficiently and effectively. Throughout the project, he kept me abreast of the progress to allow for any adjustments as needed. The quality and quantitative output of the results exceeded my expectations and provided me with more confidence in the direction of the business opportunity.
Mike ClaudioVice President Marketing and Business DevelopmentWizard InternationalSeattle
5 Circles Research has been a terrific research partner for our company. Mike combines a wealth of experience in research methodology and analytics with a truly strategic perspective – it’s a unique combination that has helped our company uncover important insights to drive business decisions.
Daniel WiserBrand ManagerAttune Foods Inc.
Great workshop! You know this field cold, and it’s refreshing to see someone focused on research for entrepreneurs.
Maria RossOwnerRed Slice
What we were doing was offering not just a new product, but a new market niche. We needed to understand traditional markets well to characterize the new one. Most valuable was 5 Circles ability to gather research data and synthesize it.
Will NeuhauserPresident Chorus Systems Inc.

Featured Posts

Dutch ovens: paying a lot more means better value

An article on Dutch ovens in the September/October 2018 of Cook’s Illustrated gives food for thought (pun intended) about the relationship of between price and value. Sometimes higher value for a buyer means paying a lot more money – good news for the seller too. Dutch ovens (also known as casseroles or cocottes) are multipurpose, [Read More]

Profiting from customer satisfaction and loyalty research

Business people generally believe that satisfying customers is a good thing, but they don’t necessarily understand the link between satisfaction and profits. [Read More]

Customer satisfaction: little things can make a big difference

Unfulfilled promises by the dealer and Toyota of America deepen customer satisfaction pothole. Toyota of America and my local dealer could learn a few simple lessons about vehicle and customer service. [Read More]

Are you pricing based on cost rather than value? Why?

At Pricing Gurus, we believe that value-based pricing allows companies to achieve higher profitability and a better competitive position. Some companies disagree with that perspective, or feel they are stuck with cost-based pricing. Let’s explore a few reasons why value-based pricing is generally superior. [Read More]

Recent Comments

  • Mike Pritchard on Van Westendorp pricing (the Price Sensitivity Meter)
  • Marshall on Van Westendorp pricing (the Price Sensitivity Meter)
  • 📕 E mail remains to be the most effective SaaS advertising channel; Chilly emails that work for B2B; Figuring out how it is best to worth… - hapidzfadli on Van Westendorp pricing (the Price Sensitivity Meter)
  • Isabelle Spohn on Methow Valley Ski Trails gets pricing right
  • Microsoft Excel Case Study: Van Westendorp-un "Price Sensitivity Meter" modeli | Zen of Analytics on Van Westendorp pricing (the Price Sensitivity Meter)

Categories

  • Overview
  • Contact
  • Website problems or comments
Copyright © 1995 - 2023, 5 Circles Research, All Rights Reserved